emeteuz Blog
  • About
  • News - Blog
  • TAC Residency
    • AIR Cycle 6 Artists
    • Spinning
    • Natural Dyes
    • Indigo
    • Workshop Planning and teaching approaches
  • Woven Signals
    • Concept
    • Mood-board
    • Research
    • Proof of Concept
    • Weaving soft circuits - Tests
    • Preparing custom conductive thread
    • Double Weave - On the Loom
    • Textile Pixels Controller
    • Making bobbins on the lathe
    • Prototype
  • Projects
    • Textile >
      • Origami Fabric #1
      • Origami Fabric #2
      • Parametric Landscapes
      • Skullwall Blanket
      • 3D Printed Textiles
      • Draping in Rhino3D
      • Weaving a touch sensor
      • Hugging Switch
      • Embroidered 555 timer
    • Wood >
      • Wooden Collar
      • Wooden Waves
    • Interactive >
      • Physical Equalizer >
        • Physical Equalizer Parts
      • WIKIPI.ME
      • Interior Weather
      • Gif Booth
      • Biomechanics
      • The Way Things Go
      • Microscopic Camera Tests
      • Physical Computing Labs
      • Processing Labs
      • Interactive Live Game
    • Paper >
      • Panther
      • Happy Ducks A Love Story
      • Triangle Shirtwaist Company Fire
    • Video and Sound
    • Animation
  • Process
    • Digital Fabrication >
      • Printing from a 3D scan
      • CNC Tests
      • CNC Surfacing - Test
      • Pumpkin
      • Parametric Design using data
      • SVG to UvertexList
    • Circuit Prototyping >
      • Variable Voltage Regulated Power Supply
      • 555 timer - LED flasher
      • Operational Amplifier
      • Protective wearable
      • Operational amplifier
      • Kinetic Energy
      • Energy and Wearables
      • Installing the Roland Modela
      • Tutorial - Setting up the Roland for milling
      • Tutorial - Milling circuit with the Fab modules
      • Tutorial - Solder Stencils with Eagle and the Silhouette Cameo

Parametric Design With Data

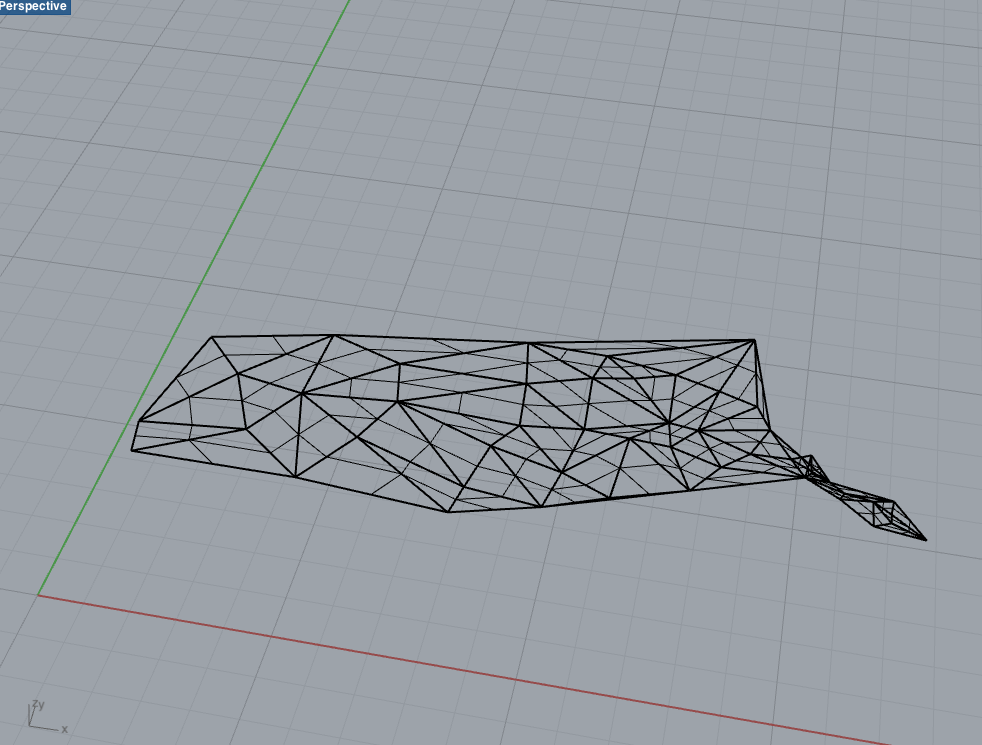
For this homework, I decided I would work with Depression stats in the United States. I created points using the average longitude and latitude of each state.
Photo
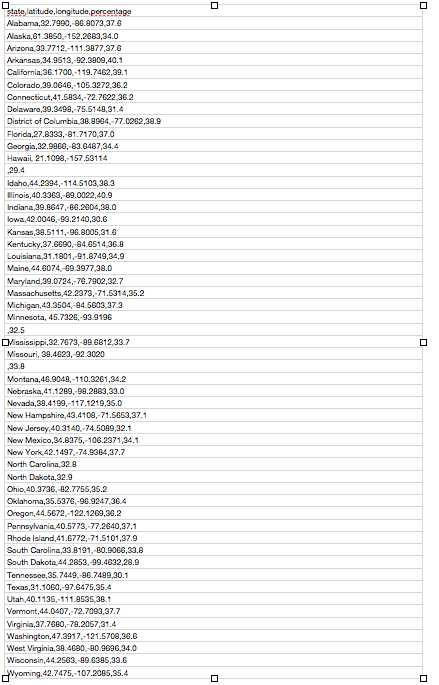
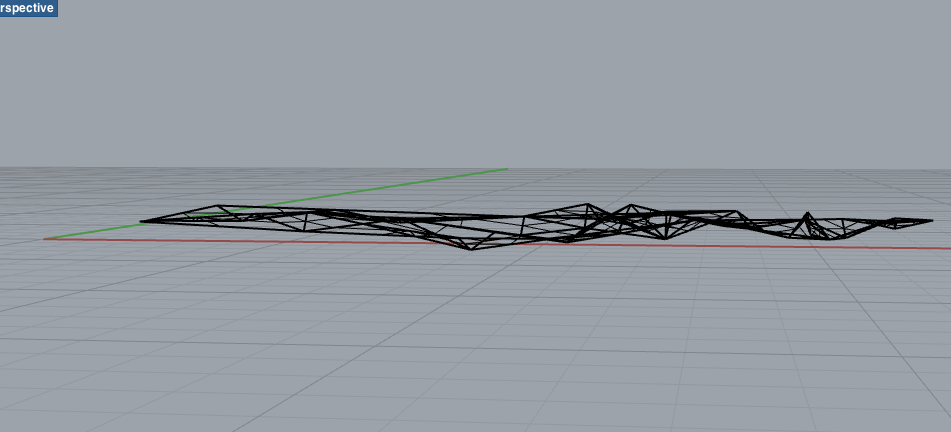
And I assigned them the depression stat associated to create a 3D shape along the normals.
Photo
Photo
Photo
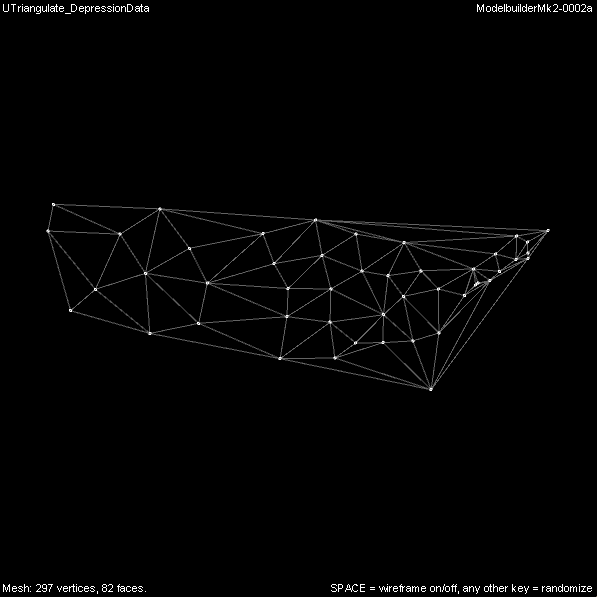
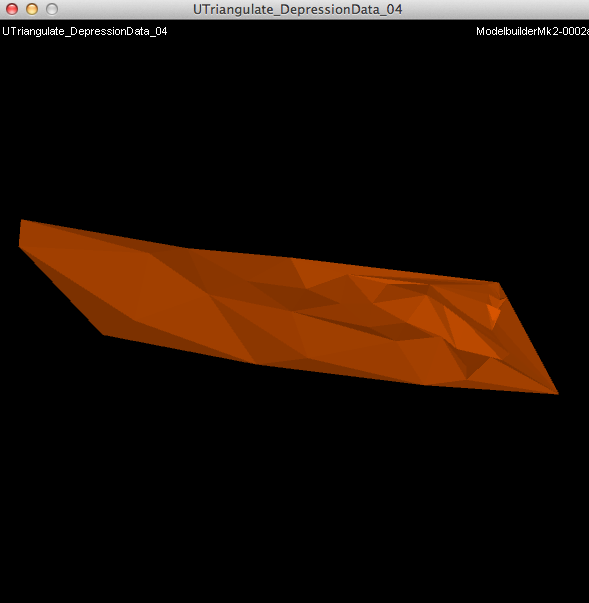
I would like to CNC the shape to see how it looks like. It is interesting to see how the shape of the country looks like when the heights of the points are generated by mental heath stats. It looks like the higher depression rates are from the South East and the Mid West. 
Photo
Photo
Powered by Create your own unique website with customizable templates.